
Running a car dealership isn’t just about selling vehicles. It’s about understanding the numbers behind every sale, every service ticket, and every parts order. Many dealerships lose money not because they don’t sell cars, but because they don’t know how to track profit properly. Financial reporting and profit analysis aren’t optional for dealerships-they’re the difference between surviving and thriving.
What Dealership Financial Reporting Actually Covers
Financial reporting for a dealership isn’t just a monthly balance sheet handed to the owner. It’s a daily pulse check on the business. A full report includes five key areas: new vehicle sales, used vehicle sales, service and parts revenue, finance and insurance (F&I) income, and overhead costs.
New vehicle sales might look like your biggest revenue driver, but they’re often the least profitable. Manufacturers set fixed prices, and margins can be as low as 1-3%. Used cars, on the other hand, can carry 10-20% margins if bought and priced right. Service and parts? That’s where real profit lives-often 40-60% gross margins. F&I products like extended warranties and gap insurance add another 15-25% to the bottom line.
But here’s what most dealers miss: overhead. Rent, salaries, utilities, advertising, and software subscriptions eat up 30-50% of revenue. If you’re not tracking these line by line, you’re flying blind. A clean financial report shows you exactly where money is coming in and where it’s disappearing.
Profit Analysis: Beyond the Bottom Line
Profit analysis isn’t about how much money you made last month. It’s about understanding why you made it-and where you could make more.
Start with gross profit per vehicle. That’s the sale price minus what you paid for the car, plus reconditioning costs. If you’re selling 15 used cars a week and your average gross profit is $1,800 per unit, you’re making $27,000 a week just from used inventory. But if you’re holding those cars for 60 days instead of 30, you’re tying up cash and paying storage, insurance, and depreciation costs. That’s a hidden loss.
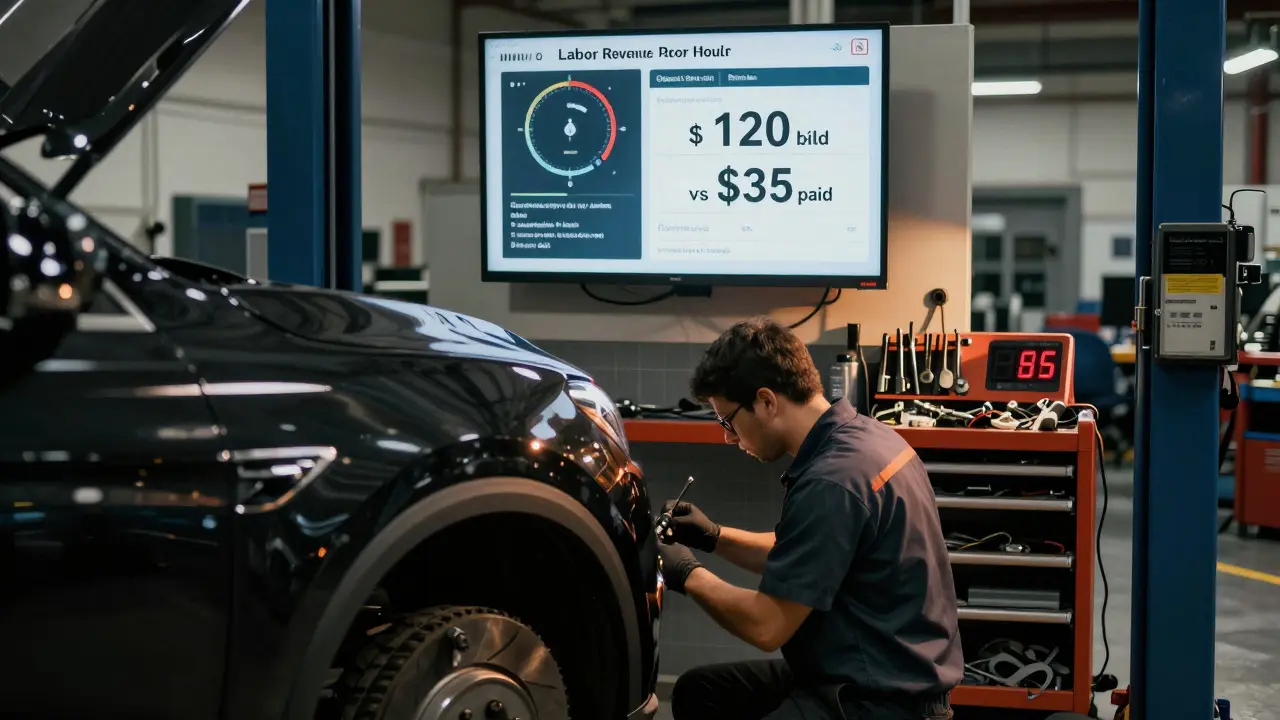
Service department profit is even more telling. A technician who does $120/hour in labor sales but only costs you $35/hour in wages and benefits? That’s a 243% gross margin. But if that tech is only working 5 hours a day because of poor scheduling, you’re leaving $1,000+ a day on the table.
Profit analysis also means looking at customer retention. A customer who comes in for an oil change today might return for brakes, tires, and an engine repair next year. Track which customers come back and which ones never return. If 70% of your service customers don’t come back within a year, you’re not building relationships-you’re just selling parts.
The Three Profit Levers Every Dealership Must Control
There are only three ways to increase dealership profit: sell more, spend less, or improve margins. Most dealers focus only on the first. The smart ones work on all three.
- Sell more: Use inventory turnover rates to spot slow-moving vehicles. If a car sits over 45 days, it’s costing you money. Move it with targeted ads, discounts, or trade-in promotions.
- Spend less: Audit your advertising spend. If you’re spending $5,000 a month on Facebook ads that bring in 10 leads, but your Google Ads bring in 30 leads for $3,000, you’re wasting money. Switch budgets where they work.
- Improve margins: Train your sales team to sell F&I products. The average dealership sells $1,200 in F&I per vehicle. The top performers sell $2,500. That’s an extra $1,300 profit per sale. That’s not magic-it’s training.
One dealership in Ohio increased net profit by 37% in six months just by fixing these three areas. They didn’t buy a new building or hire more staff. They just started measuring what mattered.
Common Financial Reporting Mistakes That Cost Dealerships Money
Many dealers use outdated tools-Excel sheets, handwritten ledgers, or basic accounting software not built for auto retail. Here are the top five mistakes:
- Not separating new vs. used profit: Mixing them together hides which side is really driving earnings. Used car profit can be 5x higher than new. If you don’t track them separately, you’ll keep overstocking new cars and under-investing in used.
- Ignoring inventory carrying costs: A car sitting on the lot for 90 days costs you $150-$300 in interest, insurance, and depreciation. If you don’t factor that into your profit calculation, you think you’re making money when you’re actually losing it.
- Not tracking F&I penetration rate: If only 30% of customers buy an extended warranty, you’re leaving money on the table. Top dealers hit 70-80%. That’s not about being pushy-it’s about proper presentation and timing.
- Using revenue instead of profit as a KPI: Selling 50 cars a month sounds great-until you find out you lost $200 on each one. Revenue is vanity. Profit is sanity.
- Not reviewing reports weekly: Monthly reports are too late. If your service department’s labor sales drop 15% in two weeks, you need to know now-not at month-end.
Tools and Systems That Actually Work
You don’t need fancy AI or expensive consultants. You need the right tools.
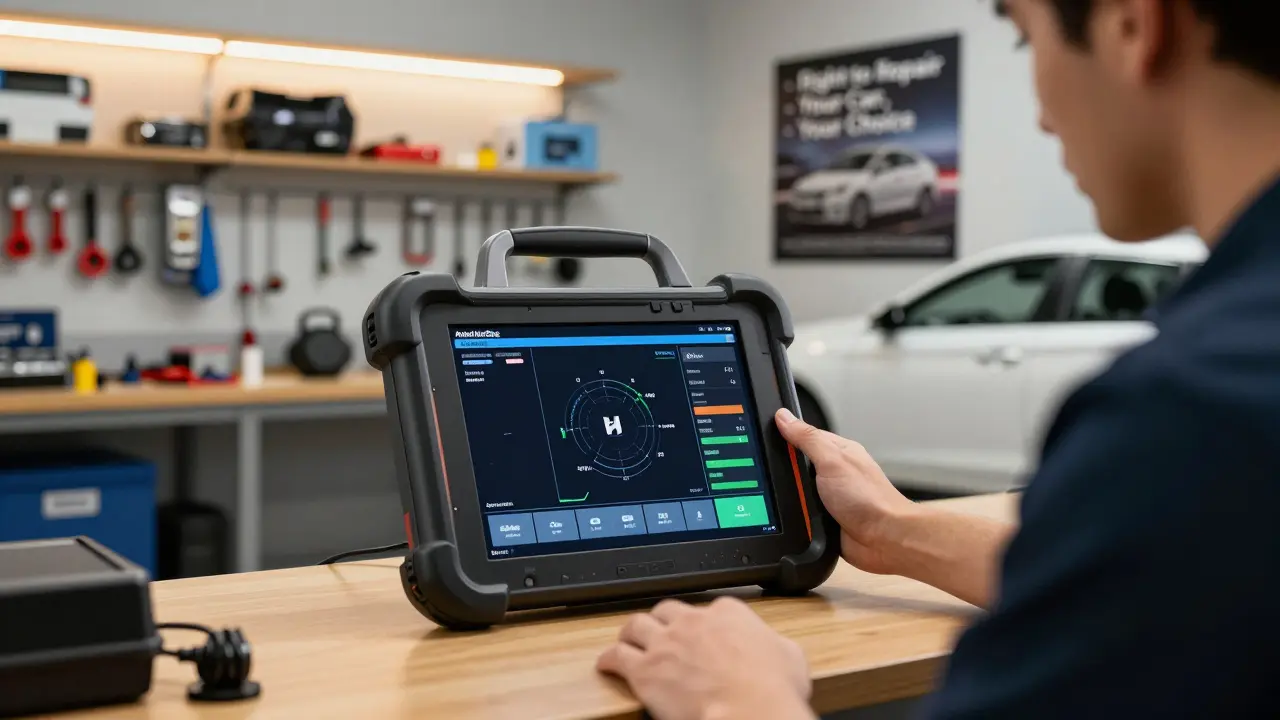
Dealership Management Systems (DMS) like CDK Global, Reynolds and Reynolds, or NADA DMS integrate sales, service, inventory, and finance data into one dashboard. These systems auto-generate daily profit reports by department, by salesperson, even by vehicle model.
Use them to answer simple questions:
- Which salesperson made the most profit last week, not the most sales?
- Which used car models turned fastest with the highest margin?
- Which service technicians generated the most labor revenue per hour?
Many dealers pay $1,000 a month for their DMS and only use 20% of its features. The ones who win? They assign one person-usually the controller or general manager-to run a 15-minute daily report review. They don’t wait for the accountant. They don’t wait for the end of the month. They act daily.
Real Example: How One Dealership Doubled Its Net Profit
A family-owned dealership in suburban Chicago was struggling. They sold 80 cars a month but barely broke even. Their accountant said, “You’re just not making enough volume.”
They hired a consultant who looked at their DMS reports. Here’s what they found:
- Used car sales made up 40% of revenue but only 15% of profit because they were buying too many low-margin cars.
- Their F&I penetration rate was 28%-below the industry average of 50%.
- Service labor sales were down because technicians were idle 2 hours a day.
- They were spending $12,000/month on radio ads that brought in 3-4 leads.
They made three changes:
- Stopped buying used cars under $10,000. Focused only on models with 15%+ gross margins.
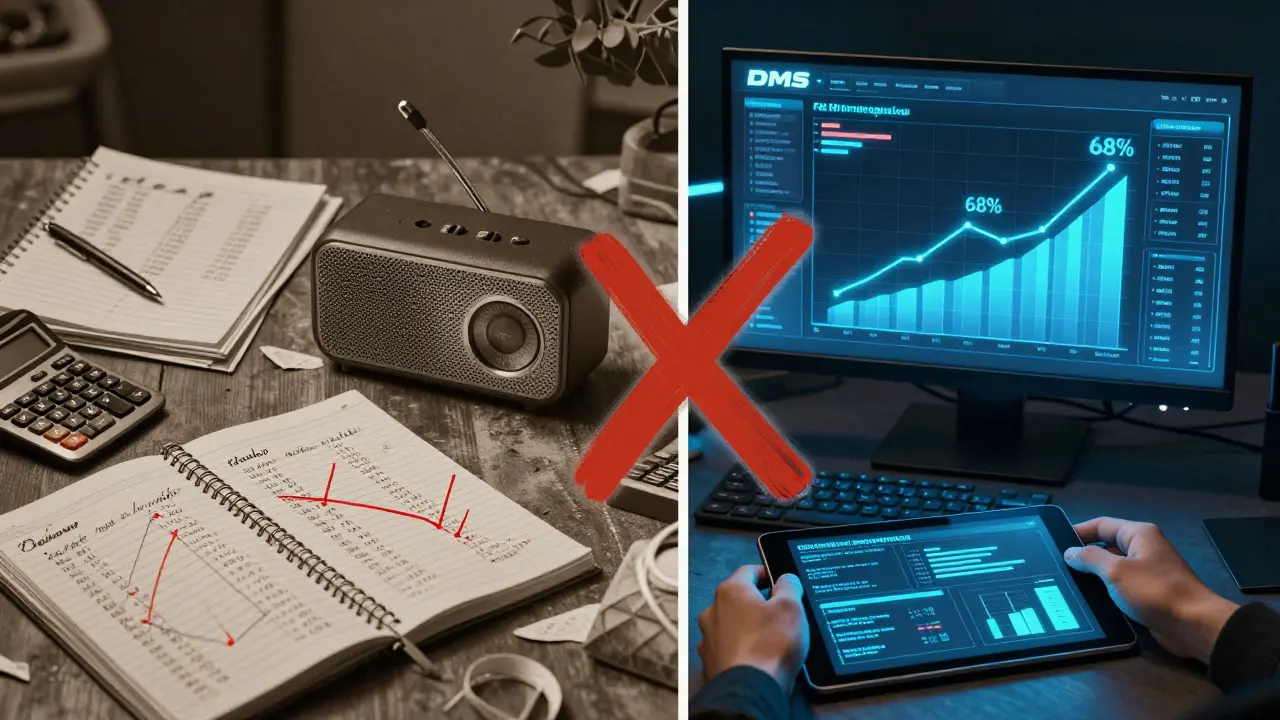
- Trained F&I managers to present warranties at the time of delivery-not after. Penetration jumped to 68%.
- Switched radio ads to targeted Facebook and Google ads. Advertising spend dropped to $6,000, but leads doubled.
In 9 months, their net profit went from $8,000/month to $16,500/month. They didn’t sell more cars. They just started measuring what mattered.
What to Do Next: Your 7-Day Profit Audit Plan
You don’t need a big team or a big budget. Start with this:
- Day 1: Pull your last 30 days of DMS reports. Separate new, used, service, and F&I revenue and profit.
- Day 2: Calculate your average gross profit per used vehicle. If it’s under $1,500, you’re leaving money on the table.
- Day 3: Check your F&I penetration rate. If it’s below 50%, train your team to sell it properly.
- Day 4: Look at your top 5 slowest-moving vehicles. How long have they been on the lot? What’s the daily carrying cost?
- Day 5: Review your advertising spend. Which channels brought in the most profitable leads?
- Day 6: Talk to your service manager. Are your technicians busy? Are they doing high-margin repairs or just oil changes?
- Day 7: Pick one area to improve. Focus on that for the next 30 days. Don’t try to fix everything at once.
Profit doesn’t come from guessing. It comes from knowing. And knowing means measuring-every day.
What’s the average profit margin for a new car dealership?
New car sales typically have gross margins between 1% and 3%. That’s because manufacturers control pricing and offer incentives that reduce dealer profit. The real profit comes from used cars, service, and finance & insurance products, which can have margins of 10% to 60%.
How do I track inventory carrying costs?
Inventory carrying cost includes interest on loans, insurance, lot maintenance, depreciation, and opportunity cost. A simple way: take the purchase price of the vehicle, multiply it by your annual financing rate (say 6%), then divide by 365. That gives you the daily cost. A $20,000 car at 6% costs about $3.29 per day to hold. If it sits for 60 days, that’s nearly $200 in hidden costs.
Is F&I really that profitable?
Yes. F&I products like extended warranties, maintenance plans, and gap insurance often have gross margins between 70% and 90%. The average dealership makes $1,200 per vehicle from F&I. Top dealers make $2,500 or more. That’s pure profit after the sale is closed.
Why is my service department not making more money?
Most service departments underperform because of poor scheduling, low labor rates, or technicians doing low-value work. The key is to track labor hours sold vs. hours paid. If your techs are billing $100/hour but only working 4 hours a day, you’re losing $600/day. Fix scheduling, raise labor rates to market levels, and push high-margin repairs like brakes, transmissions, and electrical.
Should I use Excel or a DMS for financial reporting?
Excel works for small dealers with under 20 cars in stock. But once you’re selling more than 50 vehicles a month, a DMS is essential. It auto-links sales, inventory, service, and finance data. Excel can’t tell you which salesperson made the most profit last week or which car model turned fastest. A DMS can-and it saves hours of manual work.
How often should I review dealership financial reports?
Daily. At minimum, review your DMS dashboard every morning. Look at inventory turnover, F&I sales, and service labor revenue. Weekly reviews should focus on profit by department. Monthly reports are for tax and lender purposes-not for running your business. Waiting a month to see a problem means you’ve already lost money.
Final Thought: Profit Is a Discipline, Not Luck
Dealerships that win don’t have the best location or the fanciest showroom. They have the best numbers. They know which cars turn fast. They know which salespeople drive profit. They know how much each service repair costs-and how much it brings in. They don’t guess. They measure. And they act.
If you’re not tracking profit the right way, you’re not running a business-you’re running a lottery. And the odds are stacked against you.


Honey Jonson
December 25, 2025 AT 09:40now im the one pulling reports daily and my boss is shocked we were losing money on used cars
Nathaniel Petrovick
December 25, 2025 AT 15:20i spent 2 years thinking we were killing it until i realized our F&I was at 22% and our service techs were idle half the day
now we make 3x profit and no one believes it
Sally McElroy
December 27, 2025 AT 15:02Destiny Brumbaugh
December 27, 2025 AT 16:28Sara Escanciano
December 29, 2025 AT 00:46Elmer Burgos
December 30, 2025 AT 05:21most people dont realize service is where the real money is
my cousin runs a shop and he just started tracking labor hours sold vs paid and now hes making 2k extra a week
Jason Townsend
December 31, 2025 AT 12:06Antwan Holder
January 1, 2026 AT 07:19Angelina Jefary
January 2, 2026 AT 07:59Jennifer Kaiser
January 2, 2026 AT 12:43TIARA SUKMA UTAMA
January 4, 2026 AT 11:57Jasmine Oey
January 4, 2026 AT 17:44Meghan O'Connor
January 5, 2026 AT 19:02Morgan ODonnell
January 6, 2026 AT 13:38i never thought about it like that
we had this old truck sitting for 80 days and i just realized we were paying $2.50 a day just to keep it there
we sold it last week for $300 more than we thought
Patrick Bass
January 7, 2026 AT 05:14